Lean Tutorial
This tutorial runs through all of the steps for doing a project with Marvin from start-to-finish with no extra fat. We recommend the use of ipython or jupyter notebooks when using Marvin. You can start either from a terminal with ipython or jupyter notebook.
Project Description
Calculate the [NII]/H\(\alpha\) ratio for star-forming spaxels in galaxies with stellar mass between \(10^{10}\) and \(10^{11}\) .
Sample Selection
Marvin uses a simplified query syntax (in both Web and local queries) that understands the MaNGA database schema, so you don’t have to write complicated SQL queries.
Goal: Find galaxies with stellar mass between \(10^{10}\) and \(10^{11}\).
Create the query with doQuery() and run it (limit to only 3 results for demo purposes):
from marvin.tools.query import doQuery
q, r = doQuery(searchfilter='nsa.sersic_logmass >= 10 and nsa.sersic_logmass <= 11', limit=3)
Tip: see Marvin Query to learn the basics of querying. See Example Queries and Marvin Query Syntax Tutorial for help with designing search filters.
View the Results. You may see a different set of results. That is ok as long as you see some set of results.:
df = r.toDF()
df
#    mangaid  plate    plateifu   name  sersic_logmass
# 0  1-24246   8626   8626-1902   1902       10.971793
# 1  1-24482   8626  8626-12703  12703       10.706346
# 2  1-24476   7990  7990-12705  12705       10.503103
Convert into Maps objects:
r.convertToTool('maps')
r.objects
galaxies = r.objects
Get the Maps
Alternatively, maybe we already knew our galaxy IDs, which we can use to create Maps objects:
from marvin.tools.maps import Maps
mangaids = ['1-245458', '1-22301', '1-605884']
galaxies = [Maps(mangaid=mangaid) for mangaid in mangaids]
Get the H\(\alpha\) maps:
haflux_maps = [galaxy['emline_gflux_ha_6564'] for galaxy in galaxies]
Plot H\(\alpha\) map of the second galaxy:
haflux_map = haflux_maps[1]
fig, ax = haflux_map.plot()
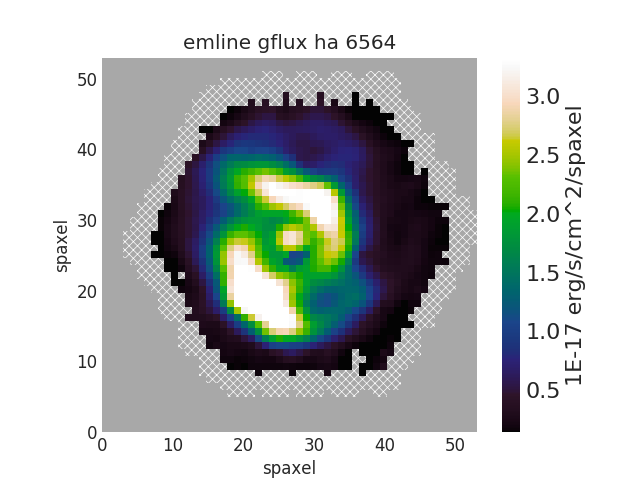
The dark blue region near the center of the galaxy looks suspicious, so let’s take a look at the model fits of those spaxels.
The easiest way is to navigate to the Galaxy page for 7992-6101 and click on the red “Map/SpecView Off” button.
However, we can also plot the spectrum and model fits in Python. First, we can find the coordinates of a spaxel by moving our cursor around the interactive matplotlib plotting window. When the cursor is over the spaxel of interest, the coordinates will appear in the lower right.
Get Spectrum and Model Fit
Then we can create a Spaxel object by accessing the parent Maps object from the Map object (haflux_map.maps) and retrieve the model fit.
spax = galaxies[0].getSpaxel(x=28, y=24, xyorig='lower', model=True)
Now let’s plot the spectrum and model fit:
# Set matplotlib style sheet. Undo with matplotib.rcdefaults().
import matplotlib.pyplot as plt
plt.style.use('seaborn-darkgrid')

ax = spax.flux.plot()
ax.plot(spax.full_fit.wavelength, spax.full_fit.value)
ax.legend(list(ax.get_lines()), ['observed', 'model'])
ax.axis([7100, 7500, 0.3, 0.65])
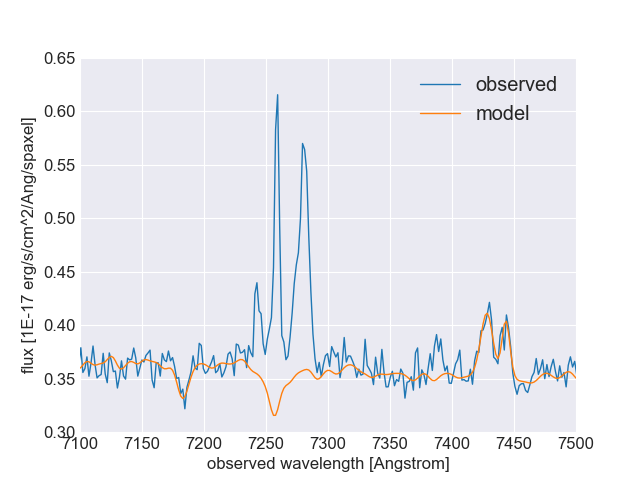
Clearly something went horribly horribly wrong in the fit. In fact, the DAP did not even try to fit a emission line component to the H\(\alpha\) and [NII] lines. This is unfortunate, but let’s press on.
Plot BPT Diagram
The get_bpt() returns masks for spaxels of different ionization types and the Figure object.
masks, fig, axes = galaxies[0].get_bpt()
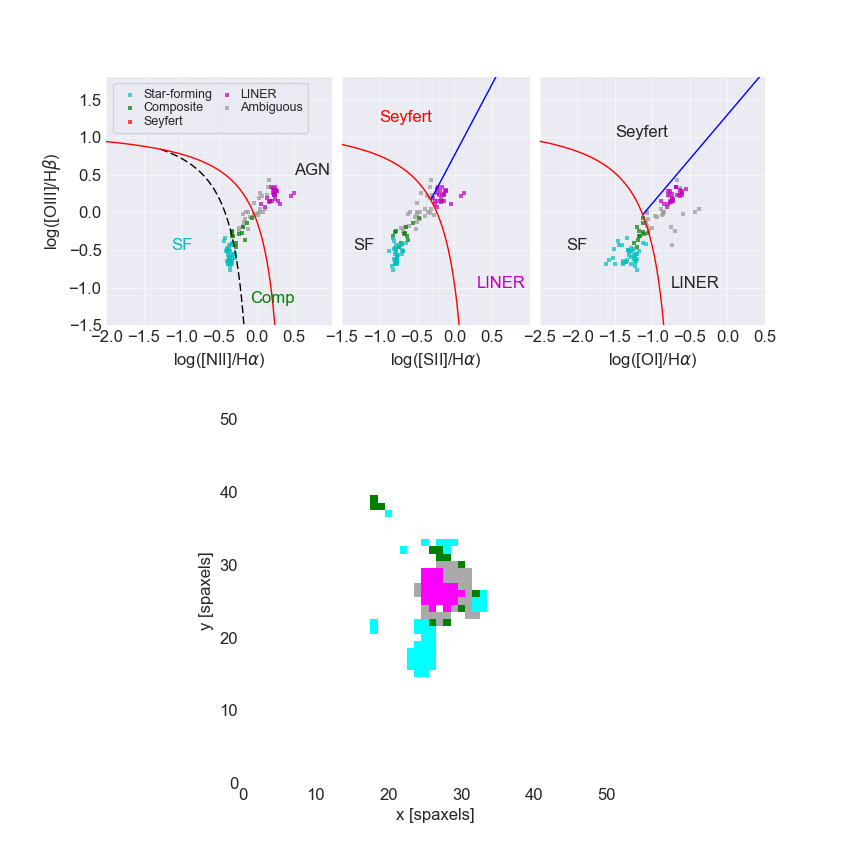
For a detailed description see BPT Diagrams.
Select Star-forming Spaxels
Select the star-forming spaxels that are in the star-forming region of each diagnostic diagram (hence the “global” keyword):
sf = masks['sf']['global']
Return the complement of the BPT global star-forming mask (True means star-forming) using ~ and mark those spaxels as DONOTUSE since they are non-star-forming spaxels.
mask_non_sf = ~sf * haflux_map.pixmask.labels_to_value('DONOTUSE')
Do a bitwise OR between the DAP mask and the non-star-forming mask:
mask = haflux_map.mask | mask_non_sf
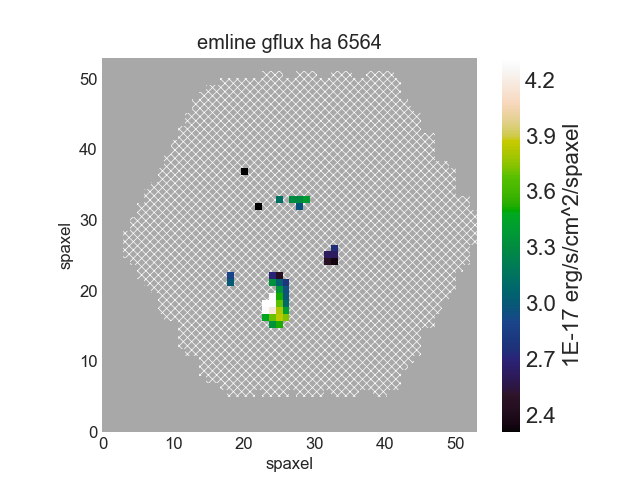
Plot with our new mask:
haflux_map.plot(mask=mask)
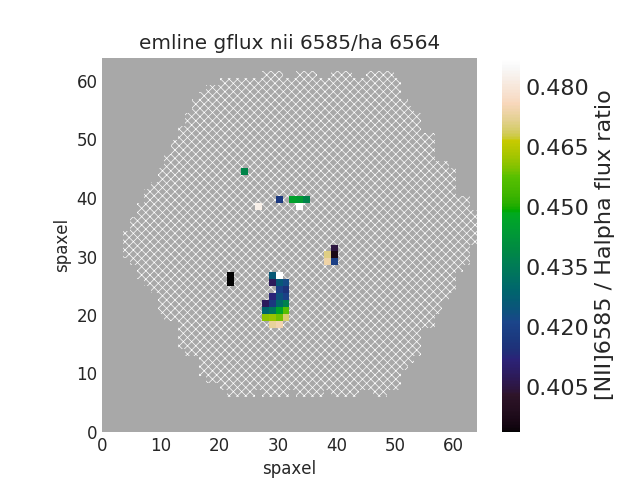
Plot [NII]/H\(\alpha\) Flux Ratio for Star-forming Spaxels
Calculate [NII]6585/H\(\alpha\) flux ratio:
maps_7992_6101 = galaxies[1]
nii = maps_7992_6101['emline_gflux_nii_6585']
ha = maps_7992_6101['emline_gflux_ha_6564']
nii_ha = nii / ha
Plot the [NII]/H\(\alpha\) flux ratio for the star-forming spaxels:
nii_ha.plot(mask=mask, cblabel='[NII]6585 / Halpha flux ratio')
Next Steps
- First Steps (more general introduction to Marvin)
- Plotting Tutorial
- Download Data (avoid repeating the same remote API calls every time you run your script)