Plotting Tutorial
General Tips
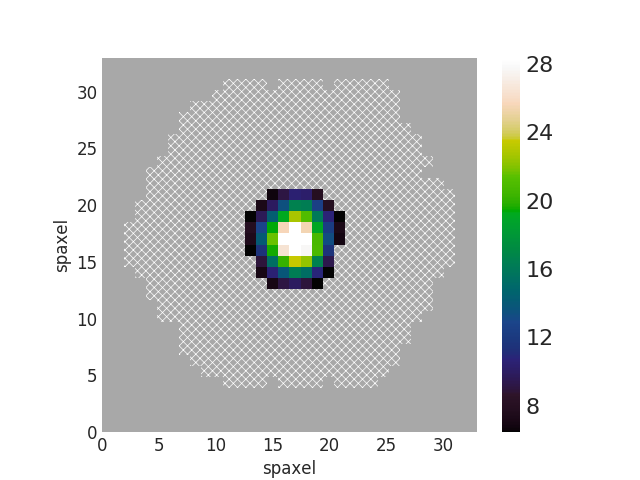
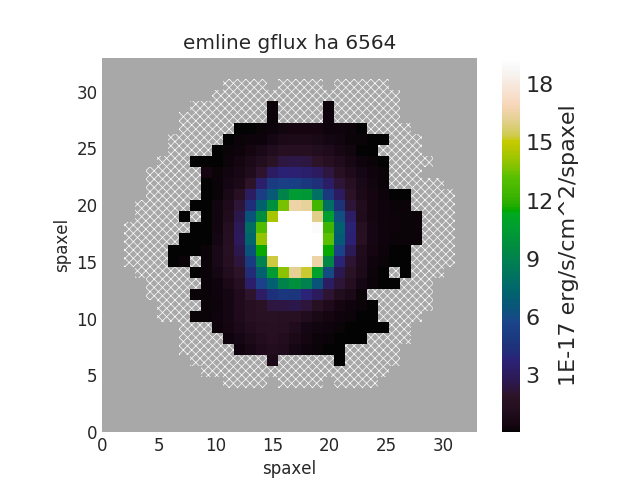
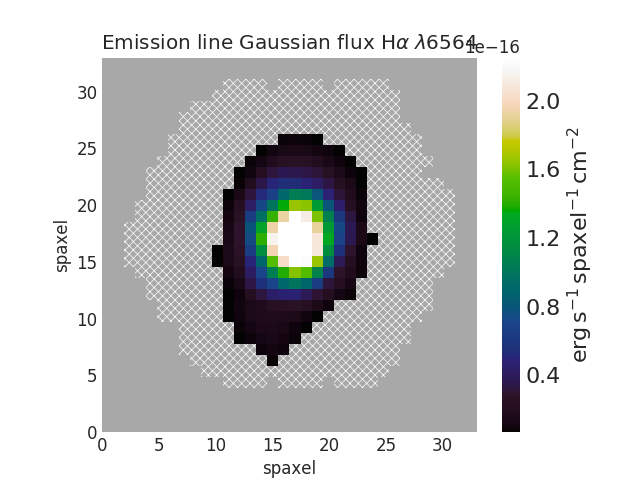
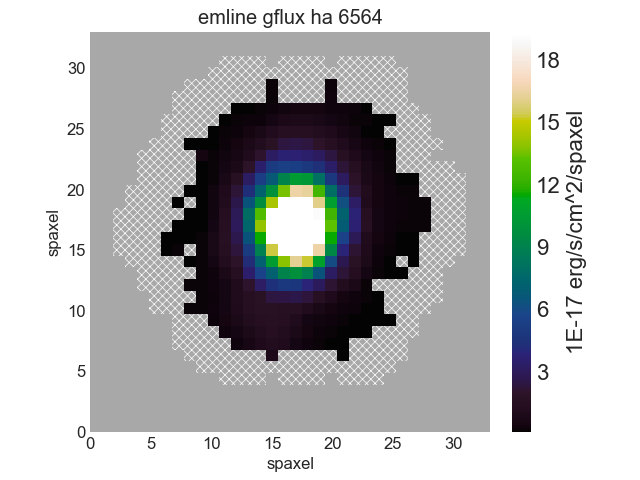
Quick Map Plot
from marvin.tools.maps import Maps
maps = Maps(plateifu='8485-1901')
ha = maps['emline_gflux_ha_6564']
ha.plot()
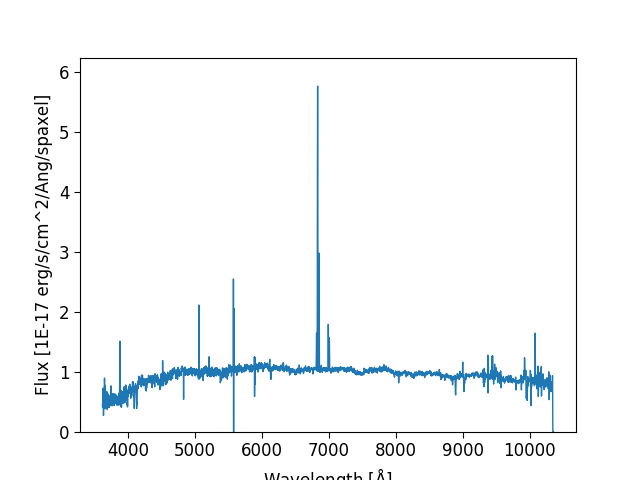
Quick Spectrum Plot
from marvin.tools.maps import Maps
maps = Maps(plateifu='8485-1901')
spax = maps[17, 17]
spax.flux.plot()
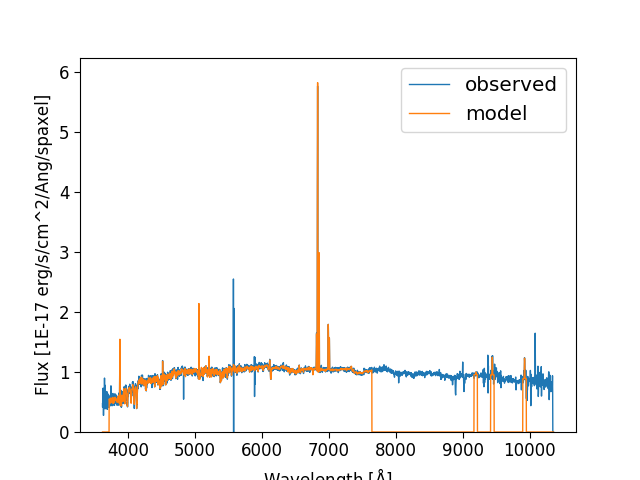
Quick Model Fit Plot
from marvin.tools.maps import Maps
maps = Maps(plateifu='8485-1901')
# must use Maps.getSpaxel() to get modelcube
# (the bracket slicing of Maps does not return the modelcube)
spax = maps.getSpaxel(x=17, y=17, xyorig='lower', model=True)
# extra arguments to plot are passed to the matplotlib routine
ax = spax.flux.plot(label='observed)
ax.plot(spax.full_fit.wavelength, spax.full_fit.value, label='model')
ax.legend()
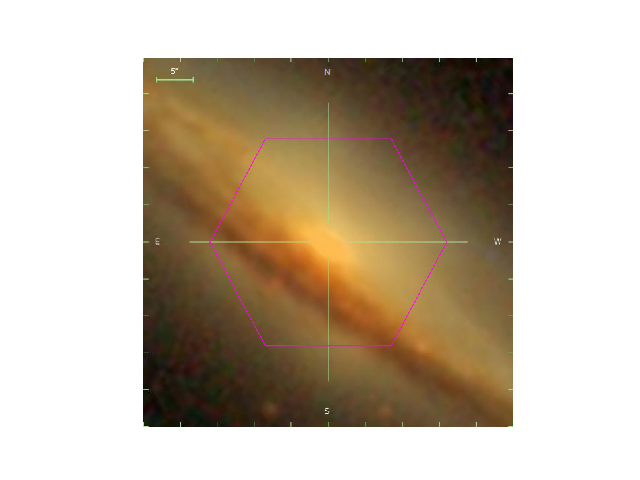
Quick Image Plot
import matplotlib.pyplot as plt
from marvin.utils.general.images import showImage
image = showImage(plateifu='8553-12702', show_image=False)
fig, ax = plt.subplots()
ax.imshow(image)
ax.axis('off')
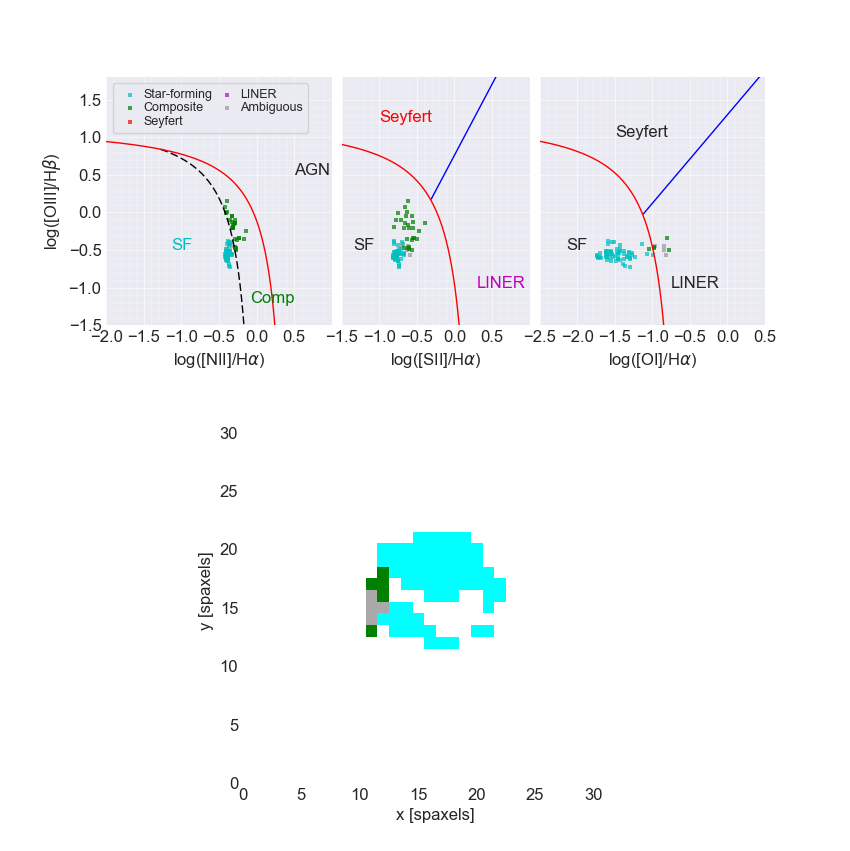
BPT Plot
from marvin.tools.maps import Maps
maps = Maps(plateifu='8485-1901')
masks, fig, axes = maps.get_bpt()
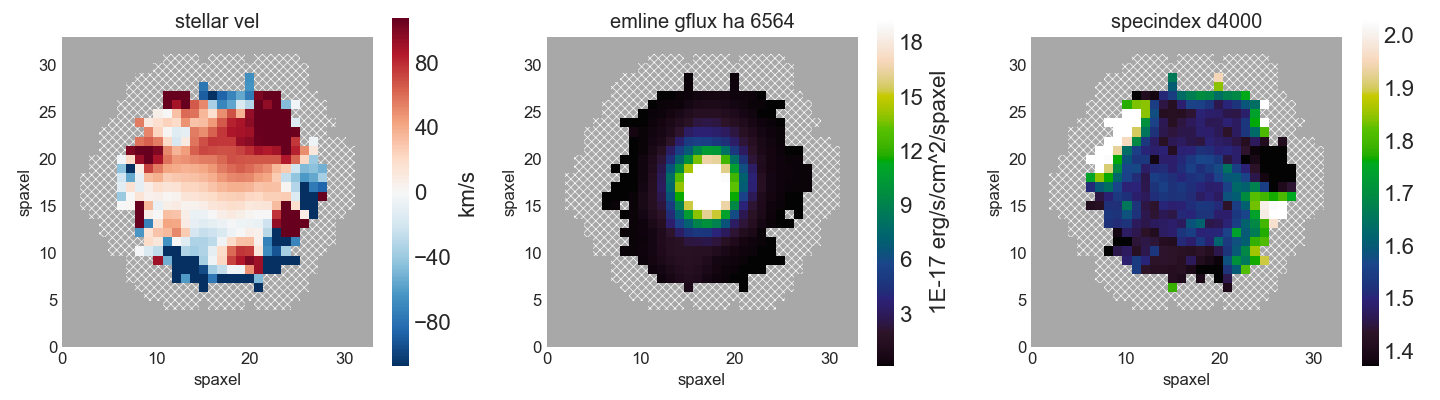
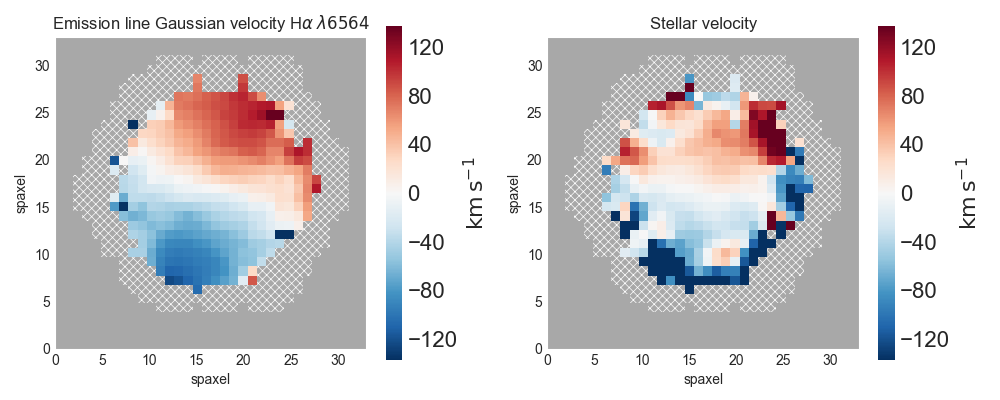
Multi-panel Map Plot (Single Galaxy)
import matplotlib.pyplot as plt
from marvin.tools.maps import Maps
import marvin.utils.plot.map as mapplot
plt.style.use('seaborn-darkgrid')  # set matplotlib style sheet

maps = Maps(plateifu='8485-1901')
stvel = maps['stellar_vel']
ha = maps['emline_gflux_ha_6564']
d4000 = maps['specindex_d4000']

fig, axes = plt.subplots(1, 3, figsize=(15, 4))
for ax, map_ in zip(axes, [stvel, ha, d4000]):
    mapplot.plot(dapmap=map_, fig=fig, ax=ax)

fig.tight_layout()
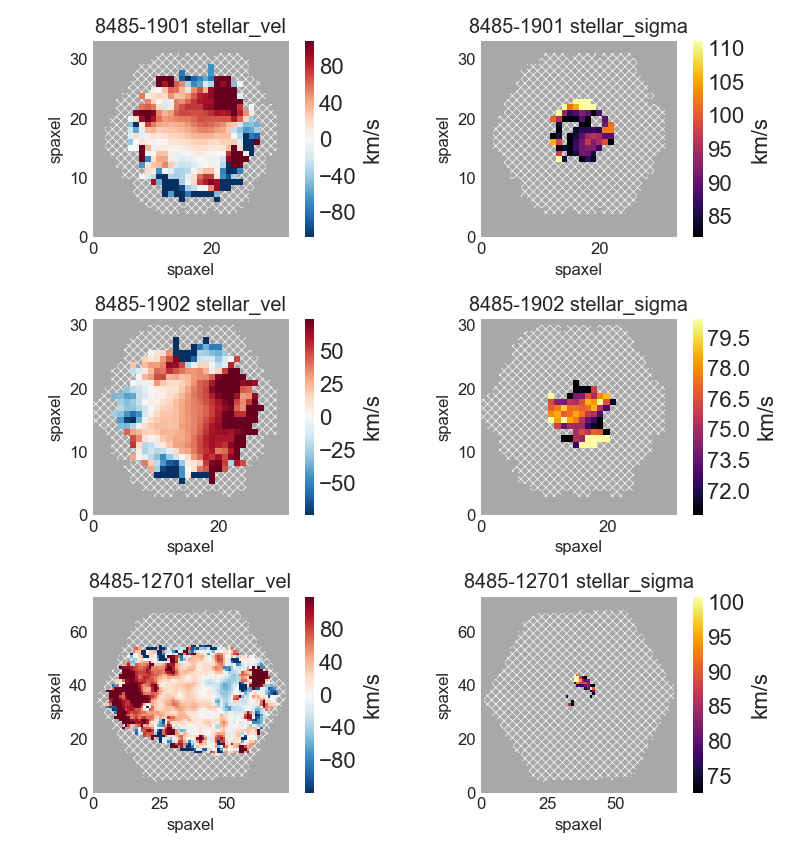
Multi-panel Map Plot (Multiple Galaxies)
import matplotlib.pyplot as plt
from marvin.tools.maps import Maps
import marvin.utils.plot.map as mapplot
plt.style.use('seaborn-darkgrid')  # set matplotlib style sheet

plateifus = ['8485-1901', '8485-1902', '8485-12701']
mapnames = ['stellar_vel', 'stellar_sigma']

rows = len(plateifus)
cols = len(mapnames)
fig, axes = plt.subplots(rows, cols, figsize=(8, 12))
for row, plateifu in zip(axes, plateifus):
    maps = Maps(plateifu=plateifu)
    for ax, mapname in zip(row, mapnames):
        mapplot.plot(dapmap=maps[mapname], fig=fig, ax=ax, title=' '.join((plateifu, mapname)))

fig.tight_layout()
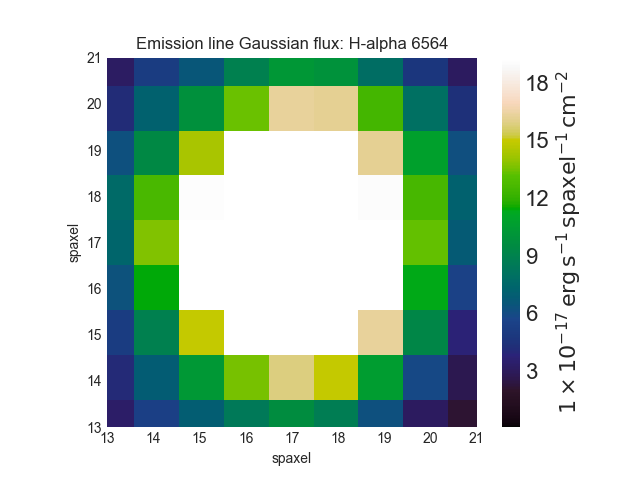
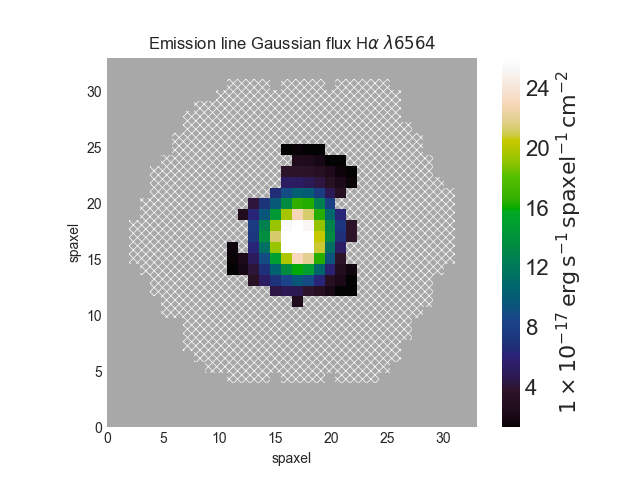
Zoom-in Map Plot
from marvin.tools.maps import Maps
maps = Maps(plateifu='8485-1901')
ha = maps['emline_gflux_ha_6564']

fig, ax = ha.plot()
ax.axis([13, 21, 13, 21])
Custom Map Colorbar Range Options
from marvin.tools.maps import Maps
maps = Maps(plateifu='8485-1901')
ha = maps['emline_gflux_ha_6564']

fig, ax = ha.plot(percentile_clip=(1, 99))
fig, ax = ha.plot(sigma_clip=2)
fig, ax = ha.plot(cbrange=[2, 10])
fig, ax = ha.plot(symmetric=True)
fig, ax = ha.plot(log_cb=True)
Multi-panel Map Plot with Matching Colorbar Ranges
import numpy as np
import matplotlib.pyplot as plt
from marvin.tools.maps import Maps
import marvin.utils.plot.map as mapplot

maps = Maps(plateifu='8485-1901')
havel = maps['emline_gvel_ha_6564']
stvel = maps['stellar_vel']
vel_maps = [havel, stvel]

cbranges = [vel_map.plot(return_cbrange=True) for vel_map in vel_maps]
cb_max = np.max(np.abs(cbranges))
cbrange = (-cb_max, cb_max)

fig, axes = plt.subplots(ncols=2, figsize=(10, 4))
for ax, vel_map in zip(axes, vel_maps):
    vel_map.plot(fig=fig, ax=ax, cbrange=cbrange)

fig.tight_layout()
Custom Minimum Signal-to-Noise Ratio
from marvin.tools.maps import Maps
maps = Maps(plateifu='8485-1901')
ha = maps['emline_gflux_ha_6564']

# Default is 1 except for velocities, which default to 0.
fig, ax = ha.plot(snr_min=10)
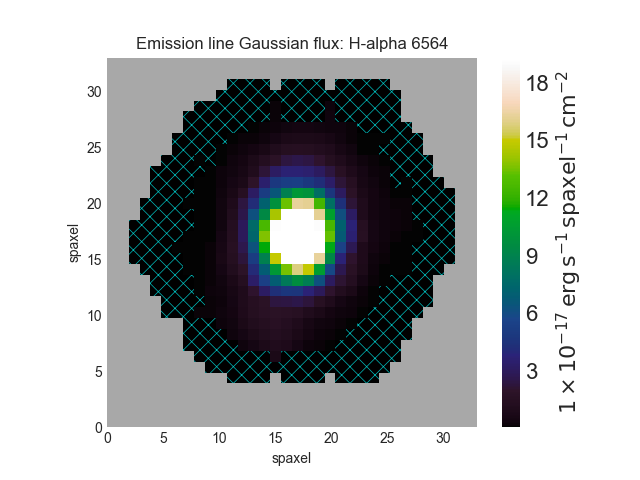
Custom No Usable IFU Data Region
from marvin.tools.maps import Maps
maps = Maps(plateifu='8485-1901')
ha = maps['emline_gflux_ha_6564']

# Defaults:
# gray background (facecolor=''#A8A8A8'),
# white lines (edgecolor='w'),
# dense hatching: (hatch= 'xxxx')

# Custom: black background, cyan lines, less dense hatching
fig, ax = ha.plot(patch_kws={'facecolor': 'k',
                             'edgecolor': 'c',
                             'hatch': 'xx'})
Custom Axis and Colorbar Locations for Map Plot
import matplotlib.pyplot as plt
from marvin.tools.maps import Maps
plt.style.use('seaborn-darkgrid')  # set matplotlib style sheet

maps = Maps(plateifu='8485-1901')
ha = maps['emline_gflux_ha_6564']

fig = plt.figure()
ax = fig.add_axes([0.12, 0.1, 2 / 3., 5 / 6.])
fig, ax = ha.plot(fig=fig, ax=ax, cb_kws={'axloc': [0.8, 0.1, 0.03, 5 / 6.]})
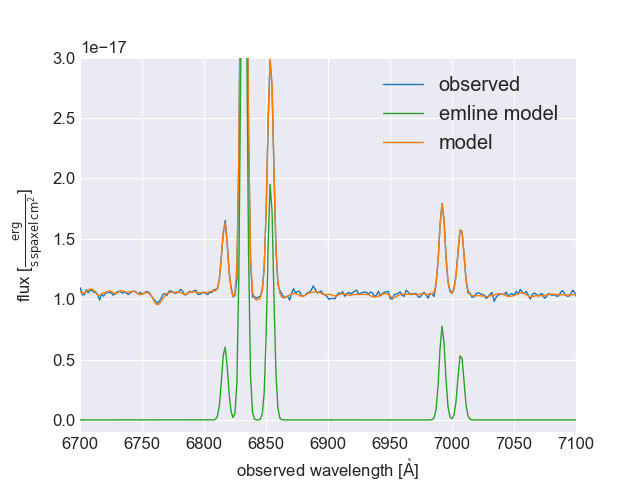
Custom Spectrum and Model Fit
import matplotlib.pyplot as plt
from marvin.tools.maps import Maps
plt.style.use('seaborn-darkgrid')  # set matplotlib style sheet

maps = Maps(mangaid='1-209232')
spax = maps.getSpaxel(x=0, y=0, xyorig='center', model=True)

fig, ax = plt.subplots()

pObs = ax.plot(spax.flux.wavelength, spax.flux.value)
pModel = ax.plot(spax.full_fit.wavelength, spax.full_fit.value)
pEmline = ax.plot(spax.emline_fit.wavelength, spax.emline_fit.value)
plt.legend(pObs + pEmline + pModel, ['observed', 'emline model', 'model'])

ax.axis([6700, 7100, -0.1, 3])
ax.set_xlabel('observed wavelength [{}]'.format(spax.flux.wavelength.unit.to_string('latex')))
ax.set_ylabel('flux [{}]'.format(spax.flux.unit.to_string('latex')))
Plot H\(\alpha\) Map of Star-forming Spaxels
import numpy as np
from marvin.tools.maps import Maps
maps = Maps(plateifu='8485-1901')
ha = maps['emline_gflux_ha_6564']
masks = maps.get_bpt(show_plot=False, return_figure=False)

# Create a bitmask for non-star-forming spaxels by taking the
# complement (`~`) of the BPT global star-forming mask (where True == star-forming)
# and set bit 30 (DONOTUSE) for those spaxels.
mask_non_sf = ~masks['sf']['global'] * ha.pixmask.labels_to_value('DONOTUSE')

# Do a bitwise OR between DAP mask and non-star-forming mask.
mask = ha.mask | mask_non_sf

ha.plot(mask=mask)
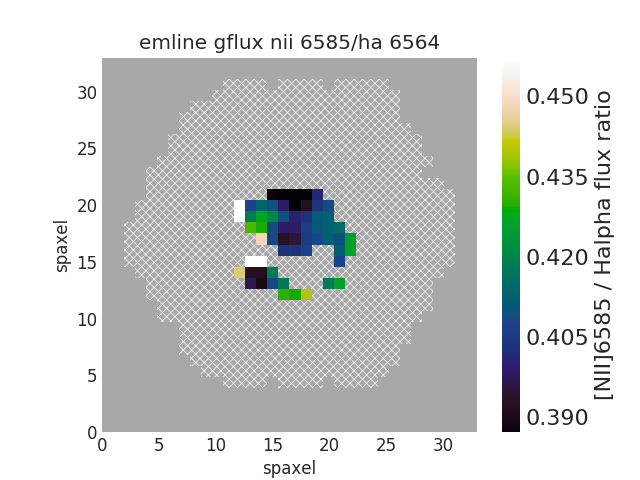
Plot [NII]/H\(\alpha\) Flux Ratio Map of Star-forming Spaxels
from marvin.tools.maps import Maps
maps = Maps(plateifu='8485-1901')
nii_ha = maps.getMapRatio(property_name='emline_gflux', channel_1='nii_6585', channel_2='ha_6564')

# Mask out non-star-forming spaxels
masks, __, __ = maps.get_bpt(show_plot=False)

# Create a bitmask for non-star-forming spaxels by taking the
# complement (`~`) of the BPT global star-forming mask (where True == star-forming)
# and set bit 30 (DONOTUSE) for those spaxels.
mask_non_sf = ~masks['sf']['global'] * ha.pixmask.labels_to_value('DONOTUSE')

# Do a bitwise OR between DAP mask and non-star-forming mask.
mask = nii_ha.mask | mask_non_sf

nii_ha.plot(mask=mask, cblabel='[NII]6585 / Halpha flux ratio')
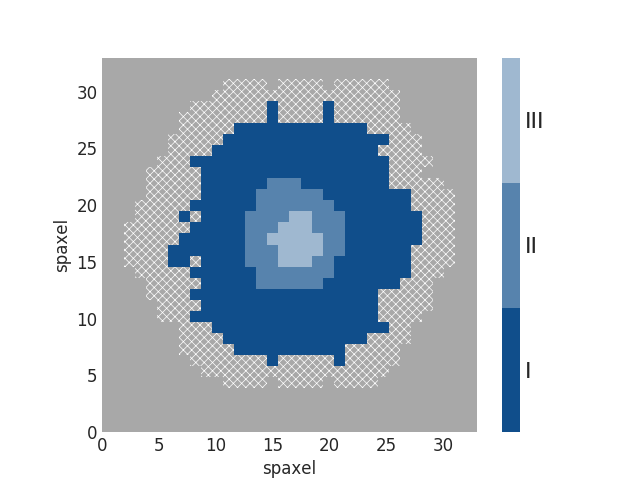
Qualitative Colorbar (New in version 2.1.4)
import numpy as np
from matplotlib import pyplot as plt
from matplotlib.colors import ListedColormap
from marvin.tools.maps import Maps
import marvin.utils.plot.map as mapplot

maps = Maps(plateifu='8485-1901')
ha = maps['emline_gflux_ha_6564']

# divide data into classes
ha_class = np.ones(ha.shape, dtype=int)
ha_class[np.where(ha.value > 5)] = 2
ha_class[np.where(ha.value > 20)] = 3

cmap = ListedColormap(['#104e8b', '#5783ad', '#9fb8d0'])
fig, ax, cb = mapplot.plot(dapmap=ha, value=ha_class, cmap=cmap, cbrange=(0.5, 3.5),
                           title='', cblabel='', return_cb=True)
cb.set_ticks([1, 2, 3])
cb.set_ticklabels(['I', 'II', 'III'])
Custom Values and Custom Mask
from marvin.tools.maps import Maps
import marvin.utils.plot.map as mapplot

maps = Maps(plateifu='8485-1901')
ha = maps['emline_gflux_ha_6564']

# Mask spaxels without IFU coverage
# nocov = ha.mask & 2**0
nocov = ha.pixmask.get_mask('NOCOV')

# Mask spaxels with low Halpha flux
low_ha = (ha.value < 6) * ha.pixmask.labels_to_value('DONOTUSE')

# Combine masks using bitwise OR (`|`)
mask = nocov | low_ha

fig, ax = mapplot.plot(dapmap=ha, value=ha.value, mask=mask)