Tools (marvin.tools)
Marvin provides tools that are convenience classes and functions for searching, accessing, interacting with, and visualzing MaNGA data. The tools make up the common core components of Marvin and are utilized within the tools itself, as well as by the Web and API.
Object-Based Tools
Marvin includes classes that correspond to different levels of MaNGA data organization:
Core Tools: Directly importable and usable
Cube: Interface to the MaNGA DRP Cube
Spaxel: Explore individual spaxels
RSS: Interface to the MaNGA DRP RSS object
Maps: Interface to the MaNGA DAP Maps
BinInfo: Explore a bin of spaxels
Model Cube: Interface to the MaNGA DAP Modelcube object
Plate: Explore all cubes for a given Plate
Image: Interface to MaNGA images
Value-Added Catalogs (VACS): Interface to VACs in Marvin
Helper Tools: Not importable but still usable
Spectrum: The object containing the spaxel flux, ivar, and mask
Map: Access individual maps
Analysis Property: Access MAPS extension information
These classes follow the MaNGA data-access-modes when determining the data location. Thus they seamlessly move between local FITS file and remote data via API.
Search-Based Tools
Marvin provides tools for easily searching through the MaNGA dataset via queries, from within your own Python terminal.
query: Perform Queries.
results: Deal with Results from Queries.
Visual Guide to Marvin Tools
All object- and search-based tools in Marvin are seamlessly linked together. To better understand the flow amongst the various Tools, here is a visual guide.
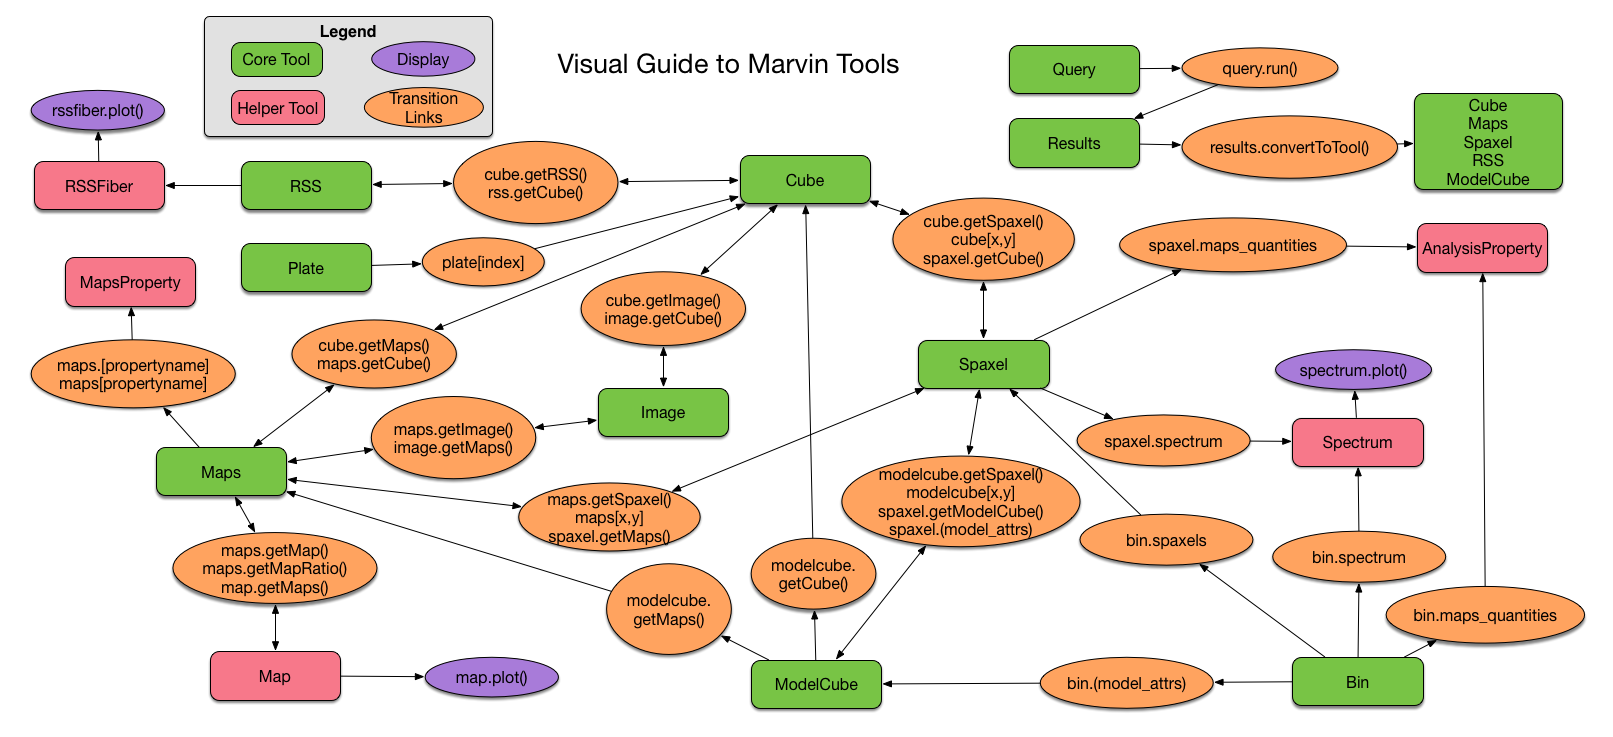
The red squares and green squares indicate the set of Marvin Tools available.
The orange circles highlight how each Tool links together via a method or an attribute. In each transition link, a
lowercaseTool name represents an instantiation of that tool, e.g.cube = Cube(). To go from aMarvin Cubeto aMarvin Spaxel, you can use thecube.getSpaxelmethod or thecube[x,y]notation. Conversely, to go from aSpaxelto aCube, you would use thespaxel.cubeattribute. Single- or Bi- directional arrows tell you which directions you can flow to and from the various tools.Purple circles represent display endpoints. If you want to display something, this shows you how which tool the plotting command is connected to, and how to navigate there.